0 %

Example Groundwater Maps

A client has a choice of map types to be used in the groundwater exploration project. However, generally these choices will be guided by a Phi’on consultant based on airborne data coverage for the area, the size of the property and groundwater needs for the client’s enterprise. Once the maps are produced by Phi’on, the client will be sent copies of the maps by email. The client will then book (bookings@phion.com.au) a telephone consultation time with a Phi’on scientist. These maps will be further used onsite to brief the client and to guide the field work to locate the groundwater bores (see images below).

Digital elevation map (DEM)

Digital elevation map (DEM)

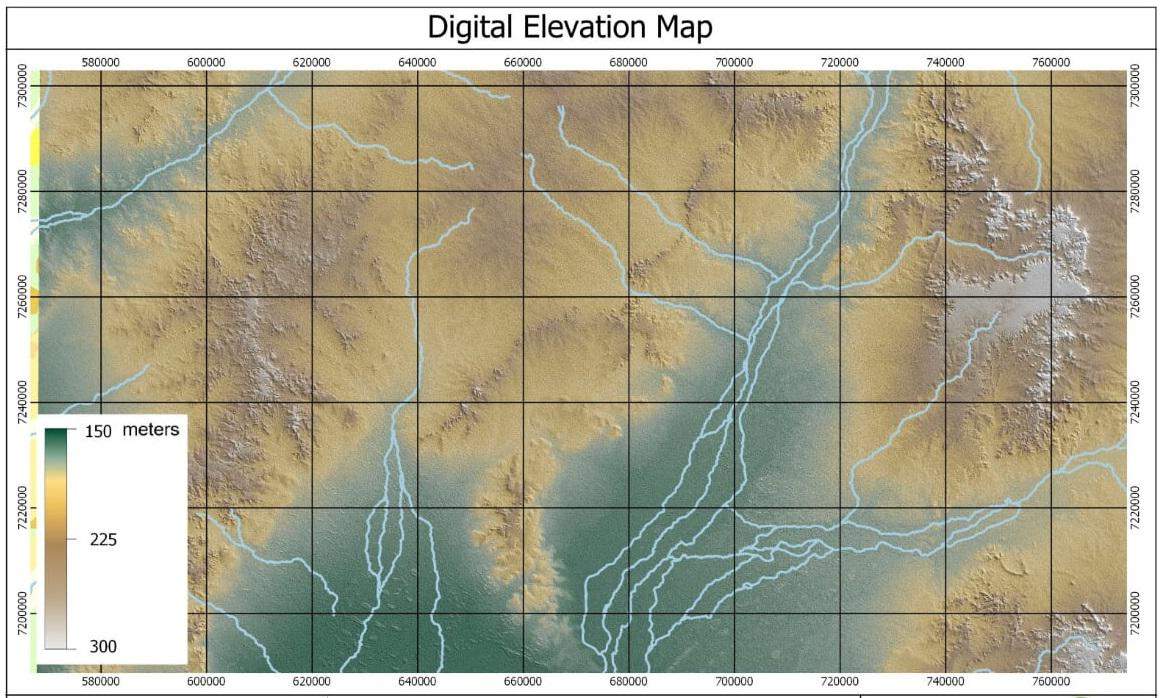
The terrain, ie. the form of ridges and valleys, can be a reasonable indicator of rock fracturing, including the direction and extent of fracturing. This digital elevation map (DEM) can also be used to define the direction of the surficial drainage system (eg. creeks and rivers), catchment boundaries slope and aspect.

Gravity map

Gravity

Gravity is the force of attraction between masses. The airborne gravity data used in this image are coarse, however the data provides another level of discrimination for the location of deep groundwater sources. The areas of most interest are the low magnetic values (blue) which can be indicators of deep groundwater basins, sinks or confined groundwater sources.

Magnetics map

Magnetics

The airborne magnetics provide the variation in magnetic emissions from the Earth. Magnetic images in this report have high magnetic susceptibility as red and low susceptibility as deep blue patterns. The deep blue represents potential groundwater sources or highly weathered rock materials. These images provide the best indicator of deep groundwater resources within this overall data set.

Radiometric total count of gamma ray

Radiometric total count of gamma ray

The radiometrics are derived from airborne gamma-ray data emissions that are the breakdown of radionuclides, such as Uranium, Thorium and Potassium. The Uranium radionuclide is the source of radon gas that can be high on granite soils and in saline pathways. Radon hotspots are in red. The radiometrics (as a total count of gamma-ray) are used to define shallow water sources or saturated soils that are often associated with low gamma-ray emissions, as seen by the deep blue in the above image.

Radiometric Composite

Radiometric Composite

This radiometric composite image highlights the variation between Uranium (purple and bright yellow), Thorium (greenish yellow) and Potassium (black).

Geology

Geology

The geology of an area provides a fundamental base for assessment of the rock system, the nature of the rock type (eg. igneous, sedimentary, or metamorphic) and the extent of rock deformation or fracturing. Geology has both spatial and time dimensions that form the dynamics or complexity of the groundwater assessment.

Aerial

Aerial

The aerial photo provides the fine resolution of land use, infrastructure (eg. buildings, dams, fence lines, trees, and roads/tracks) that are necessary for field navigation to selected bore hole sites.

Satellite (false colour)

Satellite (false colour)

The satellite data are included to provide the land cover types (eg. vegetation, crop, etc.) in the study area differences.

previous arrow
next arrow
Digital elevation map (DEM)
Gravity map
Magnetics map
Radiometric total count of gamma ray
  Radiometric Composite
Geology
Aerial
Satellite (false colour)
previous arrow
next arrow